
Heading again towards shorter — 10 h now, 5 h in two months — and colder — +1 °C now, anywhere between -20 and +5 °C in two months — days, this post looks back at late Winter and Spring 2013 and 2014, and draws a comparison for snow cover, temperatures, and tree leaf development during the two years.
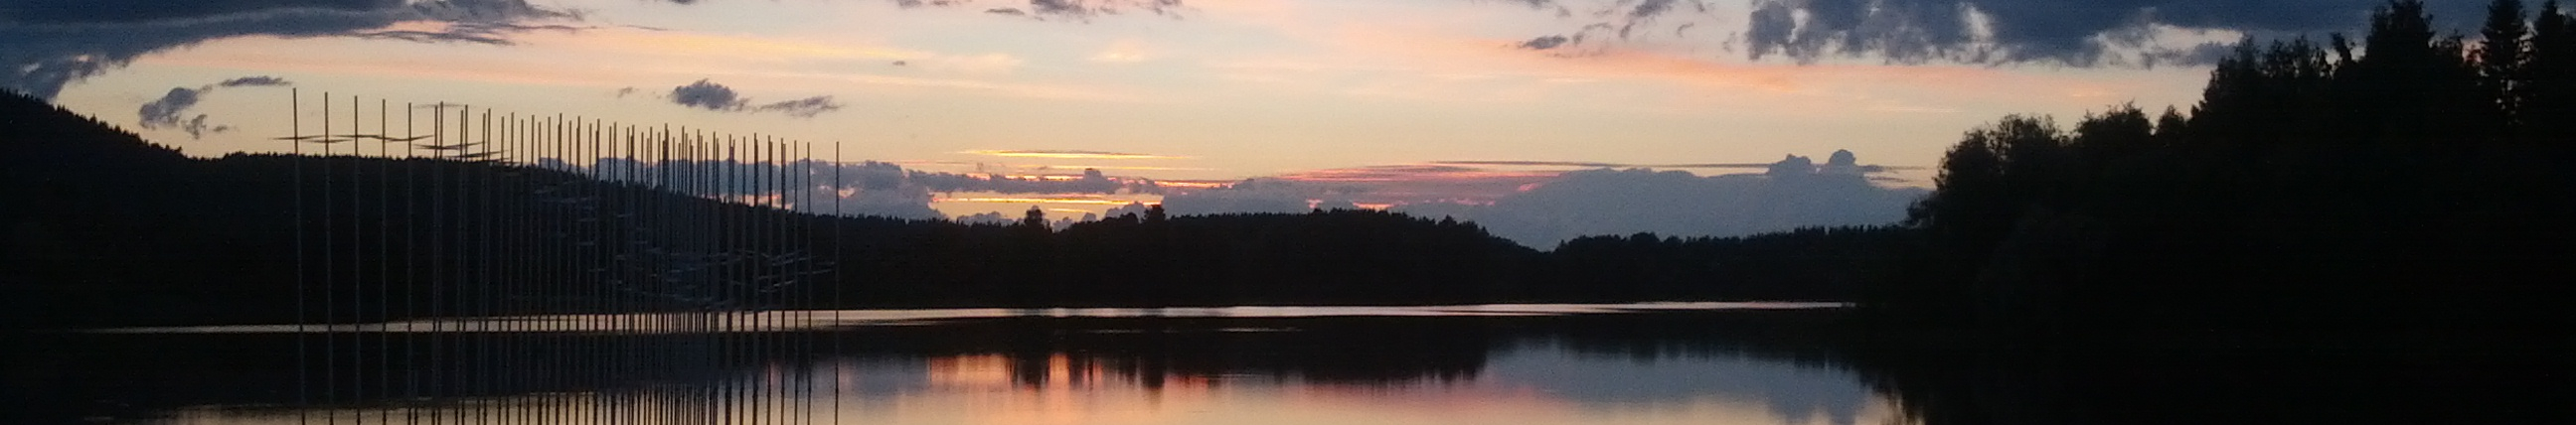
At latitude 63 degrees North, in a region with about a third of total area covered by water, temperatures can float around zero well into April. As a consequence, growing season is relatively short. The environment turns green only mid May with, however, a typical heightened enthusiasm, coming the +15 °C and more around mid May.
Things at latitude 63 degrees North can, however, be more exciting than the regularity suggested by Winter and Summer patterns overall.
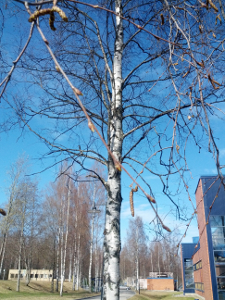
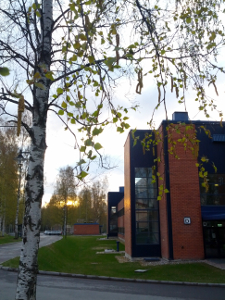
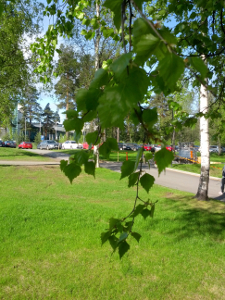
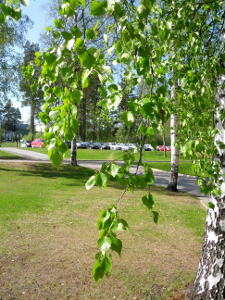
The following pictures are for roughly the same spot. The one on the left was taken on March 11, 2013 and the one on the right on March 13, 2014; essentially one year apart. While mid March 2013 there was a lovely snow cover, mid March 2014 all Winter snow had already melted.
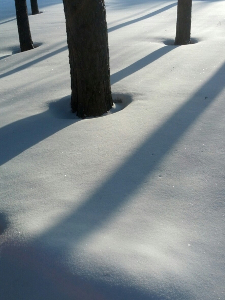
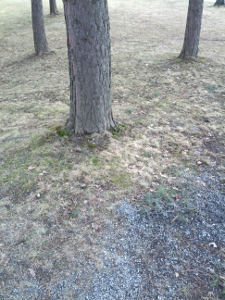
This is unsurprising considering March temperatures during the two years.
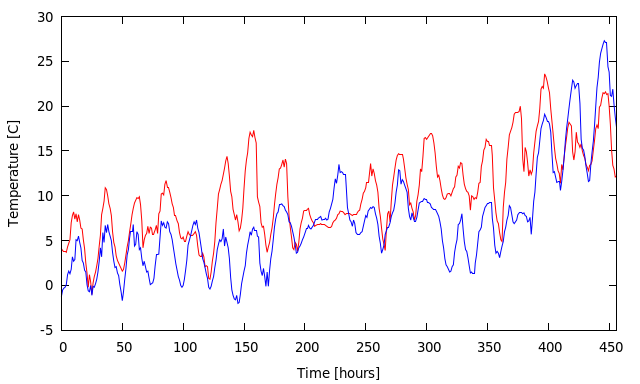
Check out the following figure. It plots the hourly time series for temperature during March 2013 in red and during March 2014 in blue. Temperature during March 2014 was essentially consisently above temperature during March 2013. Mean temperature during March 2013 was -9.3 °C; during March 2014 it was +0.8 °C. That is a big difference!
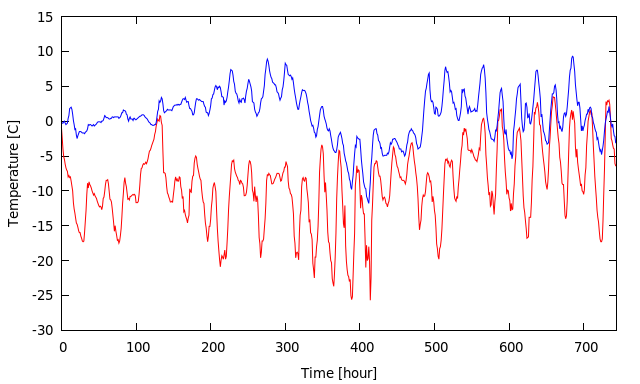
March 2014 was considerably warmer. No surprise then that the snow was gone by mid March, especially considering that the temperature during the second week of March was above zero during night and day, peaking at +7.4 °C on March 10, 2014 at 11 am. (Note that we had permanent snow cover in 2014, though snow depth was less than 2013.)
Following March, temperatures during April were roughly comparable for the two years, with increasing trend from zero to 10 °C and only occasional negative night temperatures during the first half of April.
The relatively warm March 2014 also meant earlier melt of lake ice cover. I did not take notes for when lakes were first ice free during the two springs but I would argue it happened roughly two weeks earlier in 2014.
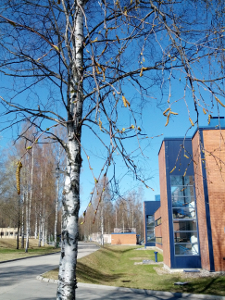
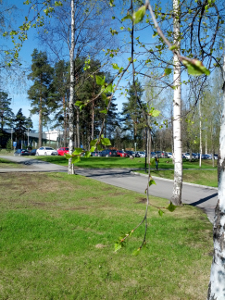
| April 21, 2014 | |
| Given the warmer March and earlier snow and ice melt in 2014, one could expect that, in addition to people, trees, too, might ride the warm wave and bring their leaves to mature earlier in order to get photosynthesis going full speed a few weeks longer during the 2014 growing season. So they did, at least initially. As early as April 21, 2014 one could notice the first buds on tree branches. The early onset, compared to 2013, seems to reflect the overall warmer temperatures during March 2014. |
 |
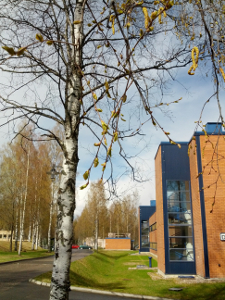
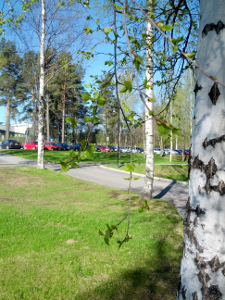
| April 27, 2014 | |
| Development moved on relatively slowly over two-three weeks between mid April and early May, 2014. Note the gaps of roughly one week between pictures, during 2014. The slow development is well in line with the slow rise of temperatures during this period of the year. |
 |
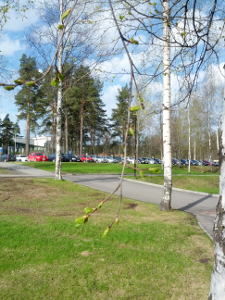
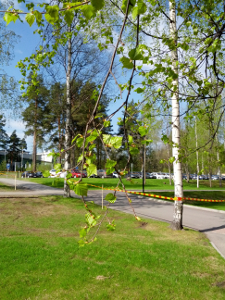
| May 5, 2014 | |
| By May 5, 2014 one could visibly notice the first green leaves, which is about one week ahead compared to 2013. Towards mid May, tree leaves in 2014 were visibly larger and trees overall clearly greener, compared to 2013. The following two pictures are essentially one year apart and underscore the different stage of development between the two years. |
 |
| May 13, 2013 | May 12, 2014 |
 |
 |
| May 15, 2013 | |
 |
Then something happenend. Development accelerated within days during mid May 2013. Development during mid May 2014 also continued at slightly accelerated pace compared to earlier weeks but was not comparable to the 2013 rate. |
| May 16, 2013 | |
 |
The gaps here are days. Only days later ... |
| May 17, 2013 | |
 |
... leaf development during 2013 made up for the advantage early onset had provided during 2014. Indeed, on May 20 it was fair to say that 2013 development was now ahead of that of 2014. Not just was leaf area greater, the 2013 grass was greaner, too. |
| May 20, 2013 | May 20, 2014 |
 |
 |
What happened? The first three weeks of May were considerably colder in 2014.
The following figure plots the hourly time series for temperature during May 2013 in red and during May 2014 in blue, till day 20 of the month. Temperature during May 2014 was essentially consisently below that of May 2013, till May 18 and with exception of May 10.
Following the relatively colder March 2013, and with Winter 2013 pushing its subzero March temperatures into April, the trees reacted to the May 2013 warmth with such enthusiasm to make up for the headstart the ecosystem had in 2014.
A good dose at the right moment can go a long way.
Acknowledgment
Historical temperature time series data was obtained via Finnish Meteorological Institute open data. The Web service is free for public use. In my opinion, the INSPIRE compliant interface is a jewel among the programmatic open data Web service interfaces for environmental data. Over the past years I have become a fond user of the interface. Kudos to FMI.